Keywords
INTRODUCTION
The study of temporal progression in biological events demonstrates the existence of predictable variations within the circadian rhythm (approximately 24 h) and other types of cycles.1 Reviews of previous studies2,3 and the development of methods useful in clinical settings have led to the creation of chronobiology laboratories4 and to the growing recognition of the role of alterations in the various biological clocks in a large number of diseases, as well as their impact on public health.5
The first studies6,7 appeared in 1937 describing an increase in mortality from acute myocardial infarction (AMI) during the winter months; later studies carried out in North America,8 Asia,9 and Europe10 confirmed these observations. In 1987, Muller et al11 pointed out the possibility of AMI and sudden death of ischemic and non-ischemic cardiac origin (presumably by ventricular arrhythmia) having a circadian variation. Simultaneously, the Framingham study12 researchers published a work that gathered information covering 38 years and 5209 cases, with similar results.
The absence of data for Spain on the influence of environmental factors on AMI is striking. There are some exceptions, such as the study13 on the relationship between thermal stress and AMI in Valencia presented at the XXXI Congress of the Spanish Society of Cardiology in 1995, and a later work by the ARIAM14 group.
OBJECTIVES
The objectives of our work were: a) to find out whether a seasonal rhythm in AMI admissions in cardiology intensive care units (CICU) exists and the mortality of these patients during their stay, and b) to determine if the age of patients with AMI influences the effect of environmental factors.
PATIENTS AND METHODS
Data Gathering
The data used were obtained from the PRIMVAC study registry (Proyecto de Registro del Infarto de Miocardio en Valencia, Alicante y Castellón).15 This registry includes exhaustive information on all the patients discharged with a diagnosis of AMI from the CICU of the participating hospitals in the Community of Valencia (Spain).
Of the 17 hospitals included in this registry, which serve around 75% of the total population of the Community of Valencia, twelve centers were selected that were listed from 1995 to 1999 without break. These centers were distributed over the three provinces of the Community of Valencia, covering 57% of the population (around 2.5 million people).
The reliability of the data and quality control regarding its processing were verified by external audit and periodic meetings of the researchers involved.15
Eight thousand four hundred patients with a diagnosis of AMI were admitted consecutively to these 12 hospitals between 1 January 1995 and 31 December 1999. The average age of the patients was 65±12 years and 76% were male.
Definition of Time Parameters
The variables were grouped by month and season. The number of days to each month was corrected with the following equation:
Standardized Months = (No. Cases/Days of the Month)x30
The seasons were delimited according to the meteorological data.
Statistical Analysis
A time series is a statistical method often used in epidemiological studies when the observations have a chronological character. Seasonal variations are studied in the components of a given variable. These show fluctuations in repeat periods which are equal to or less than a year, as well as their trend. A seasonal index (SI) with a value of 1 implies a month without seasonal variations. If the value is >1, the seasonal component is positive and is quantified (as a ratio of 1) by the difference between the index studied and 1; for example, an SI=1.03 means an increase of 0.03 (3%), and an SI=0.9 means there is a reduction of 0.1, that is 10% in the general value of the series.
To find out whether or not age has an effect on the seasonal pattern, we analyzed three subgroups, broadly accepted in most epidemiological studies,16-18 consisting of subjects ≤65-years-old , 66-74-years-old and >74-years-old.
Through the analysis of a time series we can discover a variable's seasonal variations and its long-term trend. The study of the circadian rhythm was done by applying cosinor multiple regression,3 which makes it possible to quantitatively define the rhythm in individuals, populations, or specific groups1-4 and group variables (number of admissions, number of deaths) by 12 months or 4 seasons. Its graphic representation, the simple harmonic equation, is expressed as:
Variable = C+B cos (2πt)+A sin (2πt)
where t is time (12 months, 4 seasons); C is the regression constant or mesor, which is equivalent to the average value of the function; B is the coefficient of the dependent cosine variable; A is the coefficient of the dependent sine variable; and the acrophase, the distance in time units to the peak of the function.
Seasonal variations by age groups with regard to the number of admissions and mortality were studied with the chi-square test. Values of P<.05 were taken as statistically significant.
RESULTS
Seasonal Variations in the Number of Admissions
Monthly Analysis
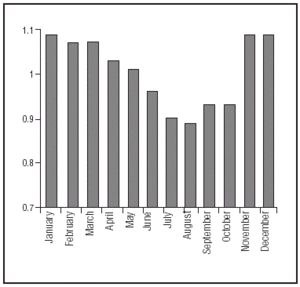
The number of admissions for AMI showed seasonal variations, with an increase in November (SI=1.09 [9% increase]), December (SI=1.1 [10.2% increase]), January (SI=1.09 [9% increase]) and a decline in August and September (SI=0.89 [11% reduction]).
The results presented in Figure 1 show with greater clarity the marked seasonal pattern of the number of admissions for AMI, with an increase in the colder months and a decrease in the warm months.
Figure 1. Graphical representation of seasonal variation indexes for acute myocardial infarction by standardized months.
Seasonal Analysis
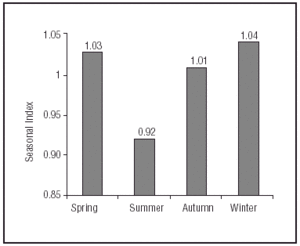
When grouping the admissions by season (Figure 2) the existence of seasonal variations is confirmed, with a greater frequency of admissions in winter (SI=1.04 [4% increase]) than in summer (SI=0.92 [8% increase]).
Figure 2. Graphical representation of seasonal variation indexes by meteorological seasons.
Trend for Number of Admissions
If we "de-seasonalize" the series, that is, if we eliminate the seasonal effect from the original series, the trend in the number of admissions is stationary, with slight fluctuations but no observed changes during the year.
Seasonal Variations in the Number of Deaths
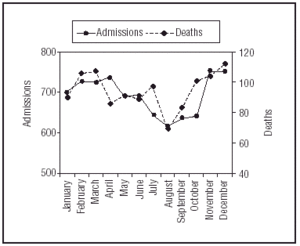
No clear seasonal variations were found in the number of deaths by month or season. The mortality graph (Figure 3) shows the same pattern in absolute values as in number of admissions. This can be attributed to the fact that the total number of deaths basically depends on the number of admissions. The percentage of mortality (Table 1) shows a seasonal pattern, although without reaching statistical significance.
Figure 3. Graphical representation of number of admissions and deaths in absolute values by standardized months.
Influence of Age on Seasonal Variations
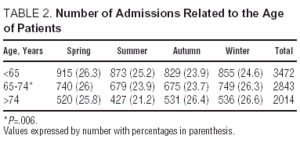
The age of patients has an effect on seasonal variations regarding the number of admissions (Table 2), with a value of P=.006.
Upon analyzing the statistical results of Table 2, we observed that the cut-off point of the age in which significant differences appear (P=.04) is =65 years.
With regard to mortality, the age of patients does not influence the effects of seasonal variations (Table 1).
Analysis of Seasonal Variations
Analysis by Month
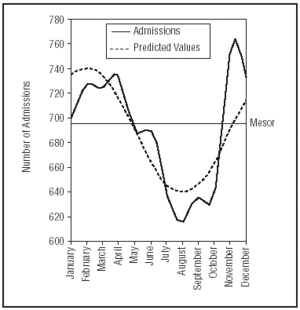
The application of the regression equation explains monthly admissions, with a coefficient of determination r²=0.66.
No. admissions = 690.6+25.67xcos (2πt)+43.98xsine (πt)
The mesor (mean value) for predicted admissions is 690, amplitude (maximum number of admissions) is 742 and the acrophase takes place in February. Figure 4 shows calculated and real values.
Figure 4. Comparison between calculated and real values in the number of monthly admissions
Analysis by Seasons
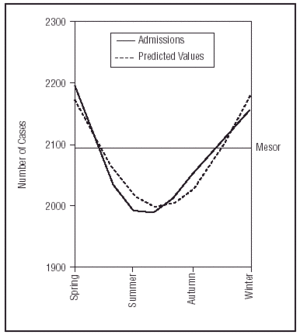
Upon applying the cosinor equation to the number of admissions grouped by seasons (Figure 5), we obtain a coefficient of determination r²=0.91 with the following formula:
Figure 5. Comparison between calculated and real values in the number of admissions per season.
No. admissions = 2099.99+82.99xcos (2πt)+73xsine (2πt)
with an average value in the number of admissions predicted (mesor) of 2100 and a maximum peak (amplitude) of 2183 cases during the winter (acrophase).
DISCUSSION
The results of this study, in accordance with other works,8-10,14,19 show that there is a seasonal variation in the incidence of AMI.
In the opinion of Douglas et al,10 this seasonal pattern has its origin in thermal stress. Other authors20 point out that temperature changes have a role in the pathophysiology of thromboembolic and hemorrhagic events in any type of cardiovascular disease. These findings have been supported by recent work,21 which points out that ambient temperature and atmospheric pressure are the best predictors of cerebral ischemia.
These works show that the relationship between thermal stress and AMI is clear regardless of geographical area. However, it is interesting that the seasonal pattern observed in the number of admissions due to AMI in Spain13,14 is the same as that found by other authors in areas such as the northern United States8 or Scotland,10 countries whose climate shows marked seasonal changes when compared to the Mediterranean climate of the Community of Valencia. This suggests that, although thermal stress has a key etiological role in the seasonal variations of AMI this is not the only factor, since the greatest number of admissions occurred during the cold months in our setting. The same questions were raised by the authors of NRMI-2 (National Registry of Myocardial Infarction-2),8 upon observing that other studies22 had found a similar increase in AMI admissions related to temperature rises in summer or to colder days in both winter and summer.23 These findings suggest the existence of other causes, independent of environmental temperature but related to sharp variations in temperature. They also suggest that the onset mechanisms of AMI, upon which environmental changes act, are probably multifactorial.
The work of Martínez et al13 explains these apparently contradictory results by demonstrating the existence of a thermal well-being range between 20 oC and 26 oC, in which fewer infarctions occur, and an area of thermal stress that begins below 10 oC and above 26 oC in which their number increases. In this case, temperature acts as a mechanism of action which has an effect on sympathetic tone, blood pressure, blood platelet functioning, etc.24,25
It is also possible that acute infections of the respiratory tract, more frequent during the cold months, contribute to the fact of AMI being more common in winter, since there is evidence of an association between respiratory acute infection and AMI.26-28
Some studies29 show seasonal variations in coagulation factors, specifically in fibrinogen and activated factor VII, with a significant increase during the cold months. This would partly explain the increase of morbidity and mortality for cardiovascular diseases in winter. The final mechanism involved in the increase of fibrinogen in colder months is not clear. Some studies30 report its relationship with acute respiratory infections, but not with ambient temperature.
The study of the mechanisms involved in the seasonal pattern of AMI is not a closed issue, because although it is accepted that thermal stress has a strong influence, other factors have also been proven to have an etiological role. A recent study31 showed a clear relationship between air pollution (sulfur dioxide values and the number of particles smaller than 10 μm per million) and the number of admissions due to cardiovascular disease. These data complement a previous work32 which demonstrated the relationship between an increase in air pollution and the levels of C-reactive protein. It may be that all these data are related and that sharp temperature variations, in addition to acting as a physical agent24,25,29 on cardiovascular pathophysiology, cause an increase in energy consumption, which implies increased air pollution, which in turn is related to cardiovascular disease.31 These issues will be clarified in future studies.
Seasonal Variations in Mortality After Acute Myocardial Infarction
We observed that mortality is lower in summer than in winter. However, contrary to other authors,33-35 we did not find statistically significant differences in seasonal variations in mortality, probably due to the size of the sample, which in our case only included 1135 deaths (159 884 deaths were included in the study by Sheth et al 33 ).
It seems clear that mortality from cardiovascular events, such as AMI, is higher in winter. This has been found to be the case not only in studies33-35 specific to acute ischemic heart disease, but also when compared to mortality from other diseases,36 such as neoplastic processes, which do not show such fluctuations. Those factors to which the increase in winter mortality is attributed coincide with those causing the seasonal pattern of AMI. However, with the passage of time, the multifactorial origin of these factors gains more weight in contrast to thermal stress as the only factor. The study of Sheth et al33 merited an editorial37 in the journal Circulation in which it was suggested that the increase in mortality from cardiovascular events in winter might be due to alterations in the biological clocks located in the suprachiasmatic nuclei, whose rhythm is determined by day-night alternation, that is, by light/darkness cycles. These cycles regulate functions such as the secretion of cortisol,38 blood pressure,39 vasomotor tone,40 tissue plasminogen activator,41 pro-inflammatory cytokines,42 etc. It might be that, instead of winter cold, the reduction in the number of hours of solar light in winter modulates these pathophysiological processes related to the increase in mortality. The work of Kloner et al,43 which analyzed 220 000 deaths due to ischemic heart disease between 1985 and 1996 in Los Angeles, California, could support this theory, as they did not find a relationship between mortality due to AMI and changes in temperature in the two peak months (December and January).
Influence of Age on Seasonal Variations
We observed that the age of patients influenced the AMI seasonal pattern. Our work shows that from the age of 65 years onwards, patients are more sensitive to the mechanisms which cause an increase in heart attacks in winter, which is supported by data from other authors.34,36 However, the results in the medical literature are highly varied and at times contradictory. Thus, in some works, the cutoff age in which seasonal variations appear is 7533; whereas others44 have reported a breakdown in the seasonal pattern after the age of 75.
Of note, the same arguments are used to explain different results. Thus, AMI seasonal pattern could be caused by an over-reaction to environmental conditions, due to the decreased age-dependant response capability to physiological circadian rhythms33,44. Obviously, more studies are required to finally clarify whether or not the age of patients influences environmental factors.
Our study does not show age as having an effect on mortality seasonal variations due to AMI, but this might be due to the size of the sample. In wider series33,34 an increase in mortality from myocardial infarction associated with age has indeed been reported for the winter period.
Analysis of Seasonal Variations
The statistical methods used to analyze the seasonal pattern for AMI vary in different studies. In fact, it is sufficient to represent graphically the number of admissions over time to notice the existence of recurrent changes and reproducible fluctuations during the months or seasons when the number of cases is above or below the average values (when there is no seasonal influence). The problem resides in finding a mathematical model that would make it possible to predict the moment at which these time-dependent variations take place and the maximum and minimum peaks of the variable under analysis.
We found that cosinor multiple regression4 is a mathematical function that fits the prediction of time variations for acute ischemic heart disease very well, and we agree with other authors2-4 that "rhythmometric" methods are mathematical models well-suited to analyze biological rhythms (chronobiology). If, in addition, we take into account that when the series was de-seasonalized the number of admissions for the population we studied remained stable, then the cosinor regression we obtained, for example, for the months:
No. admissions = 690.6+25.67xcos (2πt)+43.98xsine (2πt)
would give us an approximation of expected admissions and the date they would take place.
Limitations of the Study
The PRIMVAC registry, like any other registry, was not specifically designed to conduct a chronobiological study, but its characteristics (continuity in time and records of admission dates) made it possible to carry out rhythmometric analyses and gain a better understanding of the etiopathogenic and logistic aspects of ischemic heart disease in the Community of Valencia, Spain.
The PRIMVAC study shows admissions only to the CICU, which means that it does not record those cases admitted to other hospital departments that might have different clinical profiles.4,5 Similarly, it does not include all the hospitals of the Community of Valencia. It would be advisable to have more registries containing information from all the hospitals in order to complete the results we have obtained in this study.
CONCLUSIONS
There is a seasonal pattern in the admissions for AMI in the CICUs of the Community of Valencia, Spain, with an increase in the number of cases in winter and a decrease in summer.
The age of patients influences the effect of environmental factors on acute ischemic heart disease. This is most marked in those over 65 years of age.
Correspondence: Dr. E. González Hernández.
Pintor Ribalta, 28. 46470 Catarroja. Valencia. España.
E-mail: gonzalez_enr@gva.es

